

A/B testing in B2C Startups
Assuming you’ve determined the right balance of optimization and innovation from the above sections, we can now take a closer look at how to manage an optimization roadmap and pick the “right” experiments to run.
Creating a Roadmap
Like any good product team, you should begin with a roadmap. The roadmap should be organized in priority order with the priority determined by estimated impact and level of effort. For example, if you estimate that a certain set of tests can produce a large increase (double digit gain) in the metrics for a relatively small amount of effort (a few weeks or less of engineering and design support), then it’s likely a high priority experiment. I’ve also created a template for creating your own experimentation roadmap, which you’re welcome to make a copy of and run with it.
The roadmap has two segments to it: The first segment allows for estimating the impact of various experiments so that you can rank them in priority order. The second segment is intended to capture the results from the experiment. It’s essential to maintain a history of all experiment results so the team can conduct post mortems in order to refine their experiment selection and design.
Generally speaking, I recommend that optimization teams— such as a growth team—operate in 6-8 week sprints focused on improving one metric at a time. A common mistake I see is a small growth team trying to optimize multiple metrics in parallel. This lack of focus normally leads to subpar results. In contrast, significant results can be produced when the full weight of a growth team is poured into a single metric for at least a few months. The team will find that they improve their pattern recognition through focused effort, leading to better test results as time goes on. As an example, during my time at Quora, our growth team spent 16 months optimizing solely for sign up rate. During that time frame we increased the sign up rate from SEO traffic from 0.1% to north of 4%. Once we reached the bottom of the barrel on that particular metric, we moved onto the next metric and repeated the process. To encourage this type of focus, I broke the experimentation roadmap template into multiple tabs where each tab maps to a roadmap for a specific growth metric — e.g. churn vs. reactivation vs. signups and so on.
Picking the “Right” Experiment
Picking the right experiment to run is part art and science. By art I mean using judgement to craft a user experience worth testing. By science I’m referring to the practical constraints of testing new experiments on a relatively small population (i.e. sample size in statistics speak) when you’re still an early stage startup.
I often see startups try to run A/B tests in the same way that large companies like Google and Facebook do. They create a list of A/B test ideas that require fairly limited level of effort and then they start shipping dozens of small change tests fairly quickly. A classic example would be making changes to the call-to-action on a landing page, such as on the homepage, and perhaps testing the location of the call-to-action as well. The problem with this sort of test is that a startup often has a much smaller sample size (because they have less traffic or users of the product), so running and resolving that A/B test at high statistical confidence takes much, much longer than running a similar test at a high traffic product like Facebook. The relationship between experiment thoughtfulness and sample size is captured in the below diagram.
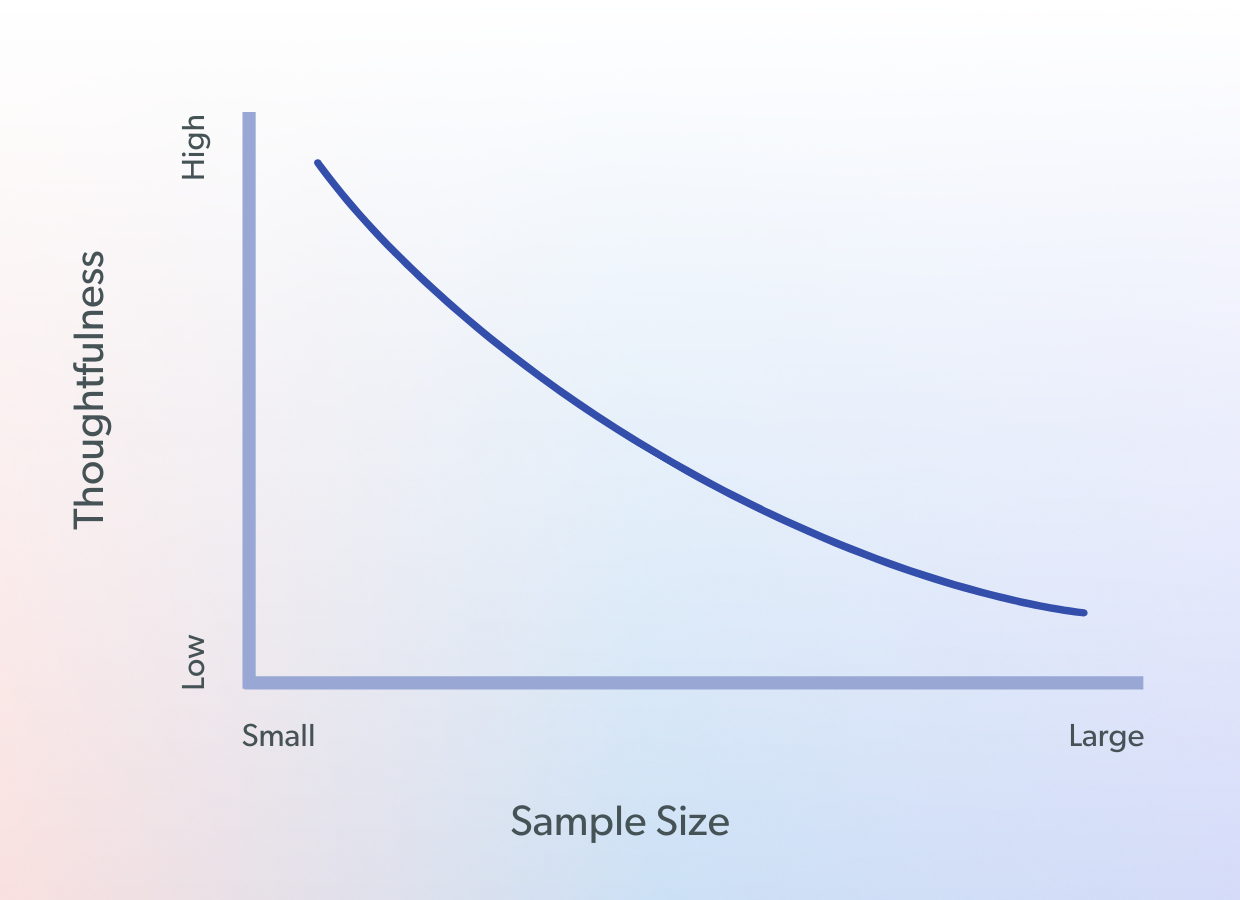
Here’s how to interpret it: Companies with a large sample size (a lot of traffic) don’t have to be as thoughtful with experiment selection and design. The reason is that the large company can make relatively small changes to the product, set up an A/B test to measure the effect, and then resolve the experiment in a matter of days at high statistical confidence because they have a wealth of data to lean on. On the other hand, a small startup with very little traffic (small sample size) needs to be much more thoughtful about experiment selection and design because an A/B test on a small sample size that produces a small change relative to the control will take weeks or months to harvest enough data to reach a statistically significant conclusion. I’ll demonstrate this effect in the below table.
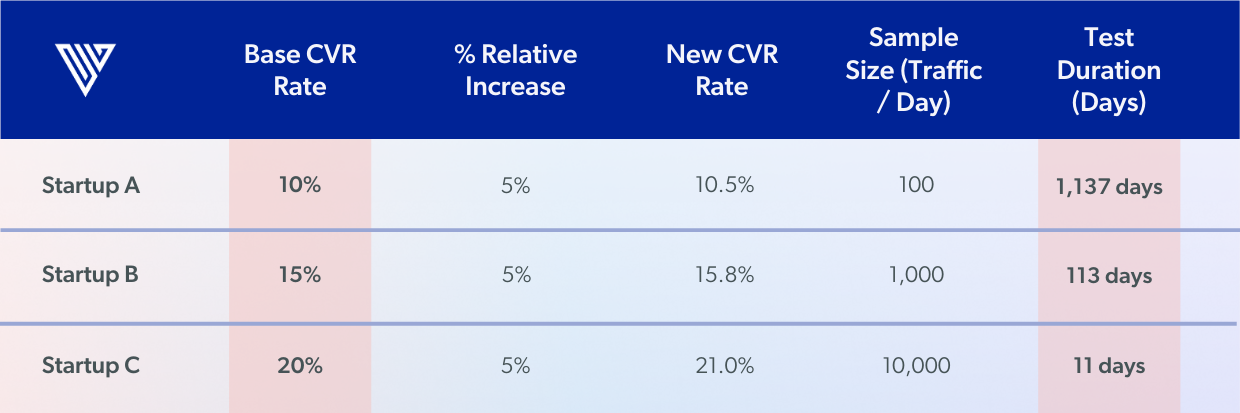
Let’s imagine we have three different startups (A, B, and C — below). Each is going to run an A/B test on their homepage where the base conversion rate is 10%, the relative increase in conversion rate they are aiming for is 5%, leading to a new conversion rate of 10.5%. However, each startup has a different volume of daily traffic. Startup A receives 100 visits per day to the homepage, B receives 1,000 visits per day, and C receives 10,000 visits per day. Using the A/B testing calculator from AB Tastyto calculate the necessary test duration, we get the following results.
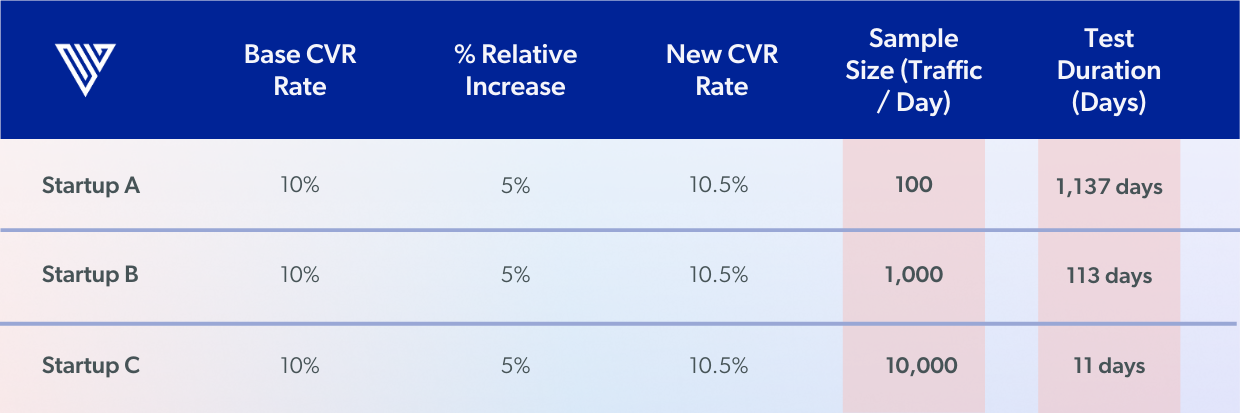
You can see from the data that the test duration declines significantly as a result of having more samples (i.e. traffic) in the test funnel. Now, let’s take a look at what happens when you tweak the magnitude of the relative experiment effect. In other words, when you run a test that produces a small, medium, or large change to the baseline conversion rate.
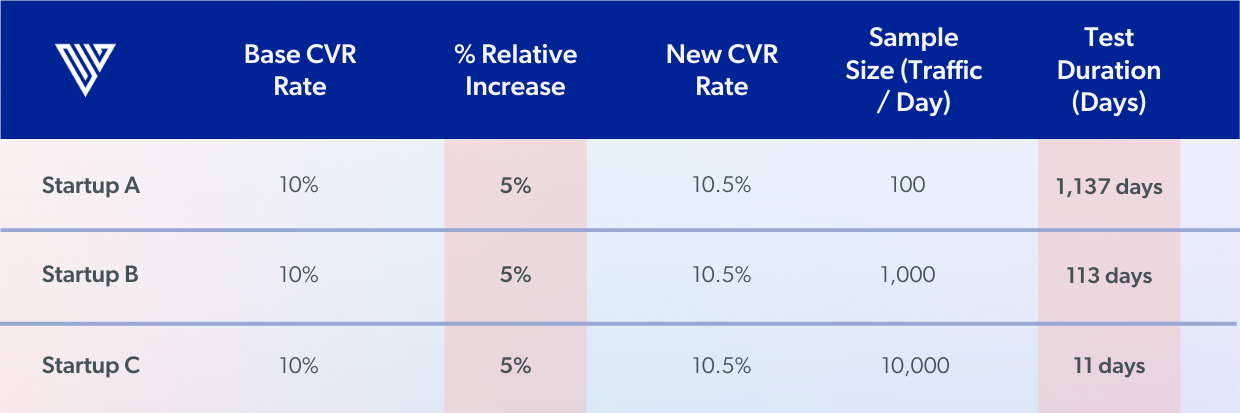
By increasing the magnitude of the relative experiment effect, the test duration declines precipitously. The key takeaway here is to aim for large changes. That seems like an obvious observation, yet I see many startups testing relatively minor changes to their product in the hopes it will produce a double digit increase in the target metric.
Finally, let’s look at what happens if we manipulate the base conversion rate. By base conversion rate I’m referring to the starting conversion rate. For example, if you have 100 visitors/day to your homepage and 1 user signs up, and you’re running an A/B test on the homepage, then you have a base conversion rate of 1%. If instead you run an A/B test midway through the sign up flow where there are 10 visitors per day, and 1 visitor manages to sign up at the end of the flow, then you have a 10% base conversion rate. What you’ll notice in the below scenario is that test duration decreases as a result of having a higher base conversion rate. Practically speaking, that means you’re more likely to reach statistical significance quicker if you A/B test in the bottom half of a funnel versus the top half since the bottom half has a higher base conversion rate.
To recap, there are a few key lessons to take away from the above scenarios:
- Smaller startups can’t test like big companies because of sample size limitations. They simply don’t have as much traffic. If they try to test small changes to the product, which produces a small relative change in conversion rate on an already small sample size, then the test will take months or years to conclude. Startups don’t have the luxury of waiting around for insignificant results like that. On the contrary, startups need to produce step change increases in their rate of growth in order to achieve liftoff and set themselves up for another funding round.
- Startups must test big changes to their product in order to manage sample size limitations. If a startup runs an A/B test for a significant product change that leads to a 30% worse conversion rate, they’ll find out in a matter of days and can quickly kill the experiment and limit the downside. If it turns out that the test produces a 30% increase in conversion rate, the company will also find out in a matter of days and can turn it live to 100% of users and experience a large increase in its rate of growth. When you think of it that way, the startup really has nothing to lose!
- The bottom half of a funnel is often a better place to test than the top half of a funnel because obtaining statistical significance on a high baseline conversion rate is more likely than on a low baseline conversion rate.
It’s essential that anyone working on an experimentation team or roadmap understands the above statistical concepts. If so, they are less likely to stack their roadmap with poorly chosen A/B tests that will take too long to run and produce results too small to change the trajectory of the company.


Lorem ipsum dolor sit amet, consectetur adipiscing elit. Suspendisse varius enim in eros elementum tristique. Duis cursus, mi quis viverra ornare, eros dolor interdum nulla, ut commodo diam libero vitae erat. Aenean faucibus nibh et justo cursus id rutrum lorem imperdiet. Nunc ut sem vitae risus tristique posuere.
.png)


.jpg)