
There’s a powerful concept known as “shipping the org chart”. It was brilliantly outlined by Steven Sinofsky in his piece on Functional vs Unit Organizations. The TL;DR is that the design of your org makes its way into your product. In other words, your product is significantly influenced by the nature of the organization you’ve designed within your company.
Here’s an example from an org chart I recently reviewed with a Series A (soon to be Series B) startup currently scaling from 15 employees to about 45.
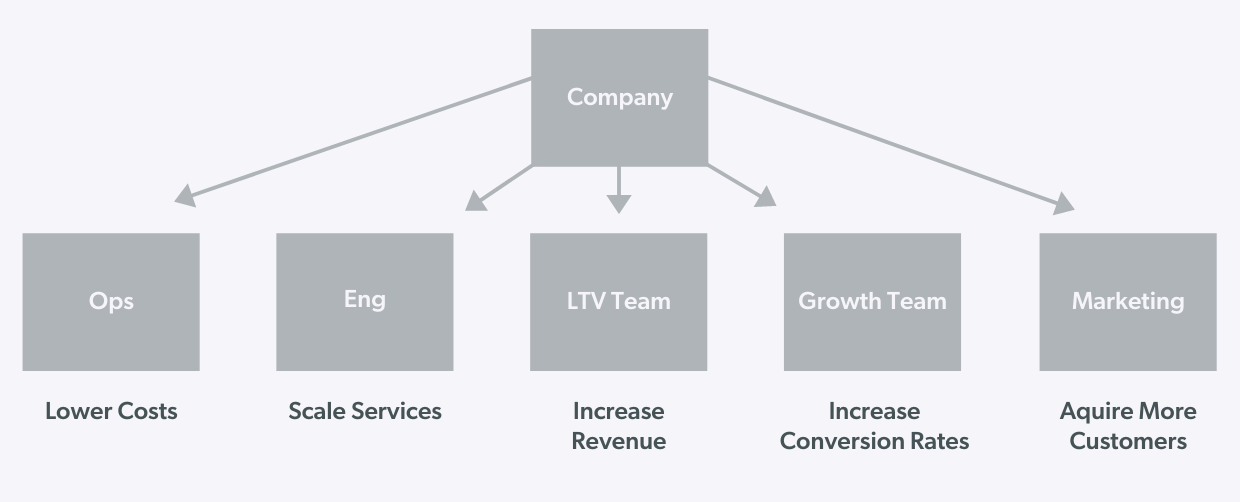
It’s a fairly straightforward org design. The ops team is focused on optimizing the field operations folks to scale their service at lower cost. The eng team is building out and scaling underlying services and products to support 10x growth in a number of customers. There are two product team. The first team is the LTV team, which is focused on increasing revenue per user. The second team— the growth team— is focused on improving all important conversion rates, such as sign up rate, new user onboarding, and so on. Lastly, the marketing team is focused on acquiring more customers.
That all seems reasonable— but, with one catch.
I asked the founders of this Series A company, “Who is focused on delivering more value to the customer?” To which I received a blank stare, followed by a bit of head scratching, and then a final, “Uhhhh … well…good question!”
The problem with an org chart like the one above is that it’s almost exclusively aligned with producing value for the business— so much so that very little attention is being given to satisfying the needs of the customer. Here’s where things get really tricky—it also pushes the company deep into optimization territory. To be specific, it’s the design of the product teams (those highlighted in green) that is most worrisome. I’ll elaborate more on this in the next section.

Imagine you have 1 junior/mid experience product manager, 1 junior/mid experience designer, and 2-3 engineers— each with a few years of experience. That’s a fairly common atomic unit of a product team within a startup. This small team now refers to themselves as the “LTV team” with an understanding that their primary metric is to improve revenue per customer. The next step for them is creating a roadmap, which they begin to do through the lens of increasing revenue per user to maximize LTV for the business.
The very first project that the team puts on their roadmap is to A/B test the pricing tiers for their subscription business. Another item on their roadmap is to A/B test variations of the subscription cancellation flow with alternative messaging and discount offers in an attempt to convince customers to not cancel their subscription. Following that, the team has fleshed out a portion of their roadmap for testing new email, in-product, and push notifications to encourage freemium users to upgrade to one of the paid tiers. Again, these are all reasonable projects to work on. The issue is that they are all focused on incremental optimizations for the benefit of the business and don’t add any additional value to the user. This is the slippery slope I alluded to a few paragraphs ago.
Fast forward 12 months and the LTV team is still busy running A/B tests, looking at funnel data, and squeezing out 5% – 10% wins via the occasionally successful experiment. Meanwhile, they haven’t shipped any new, innovative products or features that deliver substantial value to the customer (which can also increase LTV for the customer!). While exercising their data analysis and A/B testing muscles, their customer development and new product development skills have atrophied.
Jump ahead another 6-12 months and this team of highly skilled optimizers is scratching their head because the company is lagging its growth goals. They’ve continued to hire PMs whose strength is in running SQL queries and designing experiments. They’re finding the occasional 5% – 10% win, but they’re starting to get the sense that they’ve scraped the bottom of the barrel because it’s becoming increasingly hard to find a positive experiment. Meanwhile, one of their competitors is scaling more quickly, compelling them to want to run even more experiments because they’re questioning if they just haven’t run the right A/B tests yet. Anecdotally, many employees at the company notice that the amount of customer love they received on social media has slowed down. They observe a noticeable decline in feature requests and praise from their existing customers in Zendesk as well.
Meanwhile, the Growth team has been busy doing much of the same. They’ve been running experiments, building innumerable data dashboards, and commiserating with the startup’s lone data scientist as to why growth is below plan and becoming increasingly dire, despite having run dozens or hundreds of A/B tests over the last two years. Several of the tests were successful, but what gives? Why does growth suck relative to their expectations?
The product teams and company have entered what I like to call “optimizers purgatory.” They’re in a strange middle ground between succeeding with plenty of data and A/B testing abilities, minus a single meaningful innovation to the user experience in the last year or two. This sounds like an extreme hypothetical, but it’s incredibly common. I’ve personally been there and worked with dozens of other startups that have encountered optimizers purgatory as well.
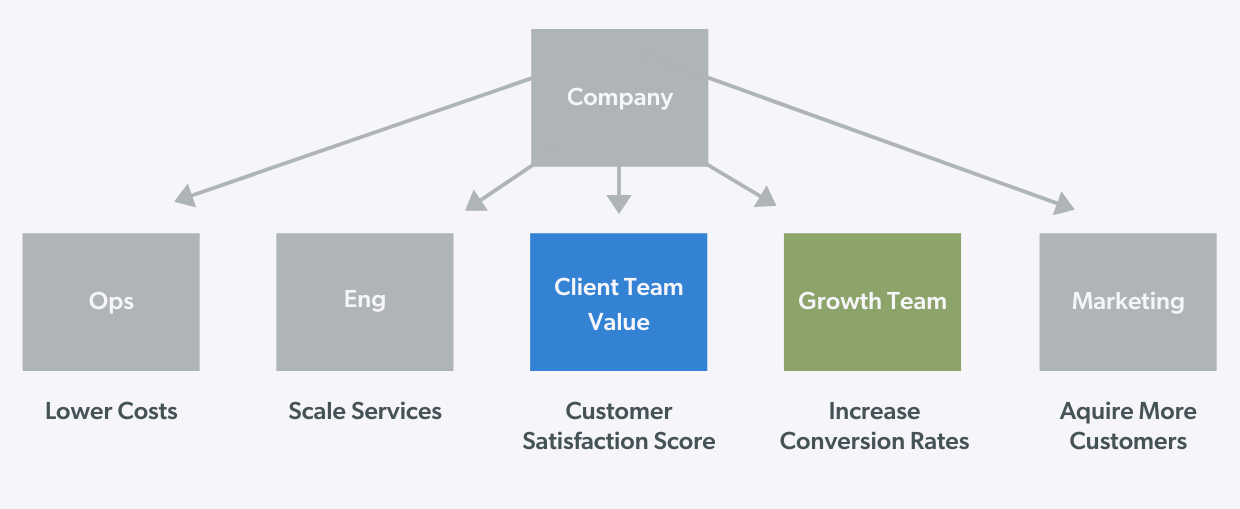
What can be done? The company could have considered an alternative to the org chart that struck a better balance between having some focus on optimizing for business value and some on innovation for customer satisfaction. This may in turn create business value far greater than the value that comes from solely optimizing for business metrics. Below is an example alternative that swaps the LTV Team for a Client Value Team. This new team’s primary metric is customer satisfaction score— e.g. the percent of customers “very satisfied” with their experience.
Take the same atomic unit of a team (1 PM, 1 designers, a few engineers) and you’ll find their roadmap is wildly different than the LTV Team’s roadmap. This difference is simply because their team name implies creating new value for the customer and their primary metric requires that they increase customer satisfaction. Recall the LTV Team had a roadmap full of A/B tests focused on optimizing the business metrics. The Client Value Team’s roadmap is more likely to contain a list of new, high value features that customers have been asking for and new, innovative value that customers weren’t expecting to receive, but will be delighted with.
In contrast to the LTV Team, the Client Value Team will develop their customer development and product development muscles. They’ll have well-defined customer research and design research methods. They’ll likely also develop a closer relationship with the customer service employees within the company, leading to regular meetings with the head of customer service where they review the latest Zendesk customer requests. They’ll have fewer data dashboards and won’t be able to speak as eloquently about the parts of the product that are well optimized, but they will be able to speak about which customer complaints have tapered off and which new customer requests have bubbled to the surface.
The LTV Team and the Customer Value Team have become two very distinct organisms, simply because of the name of the team and the type of metric chosen— i.e. a customer success metric versus a business success metric. This is the notion of “shipping the org chart” at play and it’s an essential concept to understand when thinking about designing an organization with the intent to grow the business.
When working with founders on creating an org chart that adequately balances growth from optimization and innovation, I give them the following exercise:
Step 1: Concisely describe your mission and vision for the next 2-3 years
Step 2: List the 2-3 things that must be true for your customer to realize that vision
Step 3: Design an org with product teams that map to the 2-3 truths for your customer
Step 4: Revise and edit until satisfied with the results
Here’s a practical example from Wealthfront, where I was most recently the President:
Step 1: Wealthfront’s mission is to provide everyone access to sophisticated financial services with the vision that our customers would use Wealthfront to exclusively manage all of their finances.
Step 2: In order for that mission and vision to be true, our clients would need to (1) create a free financial plan that captures their needs and wants; (2) have a superior set of banking products relative to what they could get at large banks; (3) have world-class investment management that’s typically only available to the ultra wealthy.
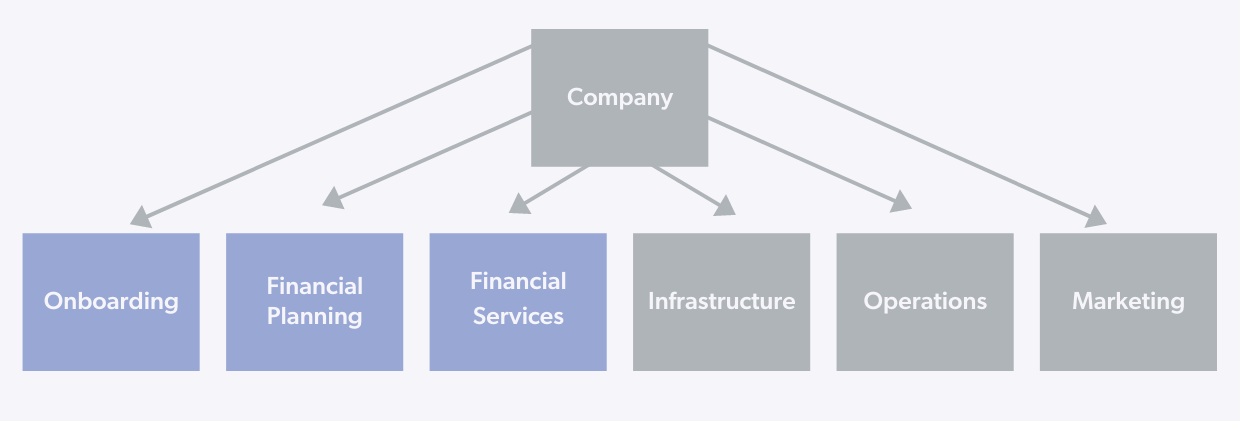
Step 3: We set out to design the primitives of a product organization that reflected 1 and 2 above. It looked something like this:
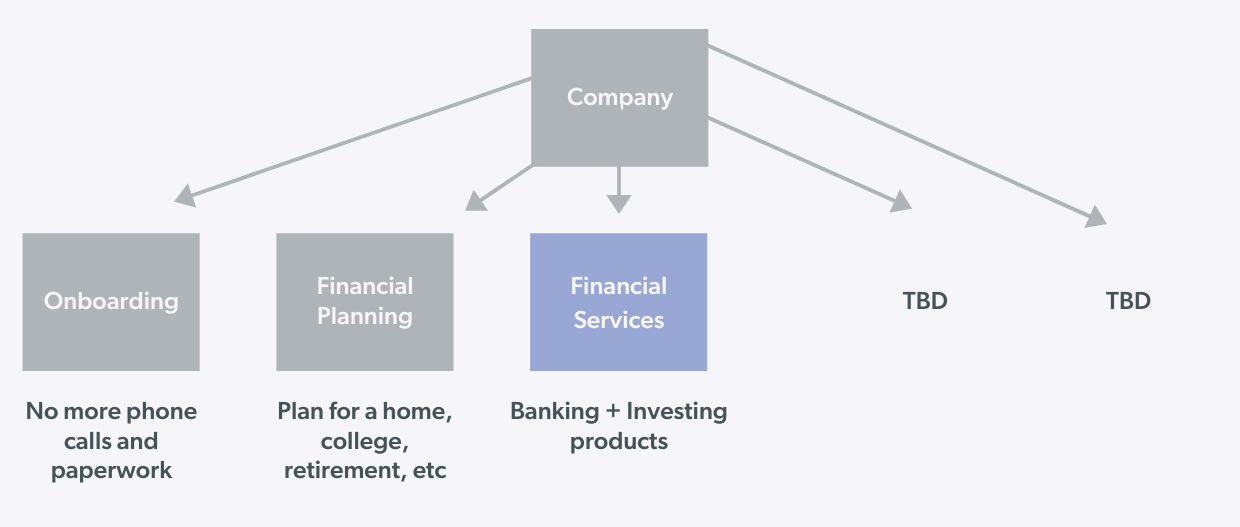
We came up with an Onboarding Team that would digitize many of the financial processes traditionally handled over the phone or via paperwork. By digitizing these experiences, we could ensure “everyone gets access”, per our mission statement. The Onboarding Team’s primary metric was customer satisfaction. For this metric, they measured the percent of users that were very satisfied with various parts of the onboarding experience. We made the leap of faith that if the customer was more satisfied with the experience, they would trust us with more of their money ( our data science team proved to be true). That ensured we took a very customer-centric approach to innovating with the onboarding experience.
Secondly, we created a Financial Planning team to build out a whole new suite of products, so that our clients could get more value out of Wealthfront beyond just investment management (the company began with this offering). Finally, we had a Financial Services Team that would build the next generation of investing and banking products, so that our clients could get access to financial products typically reserved for the rich.
Step 4: Once we had those teams in place with a clear charter for creating new innovative products (as opposed to simply optimizing the products we already provided), we put the rest of the company org in place.
And within the product organizations, we could then provide guidance on the proportion of their roadmaps/time and effort spent on creating new feature innovations versus optimizing for growth with the existing feature set. For example, one might ask each product team to construct roadmaps that are 70% focused on building new value to the customer and 30% spent testing and optimizing for key business metrics related to their product line. With this approach to org design, a startup can be very explicit with its allocation towards growth through both optimization and innovation.

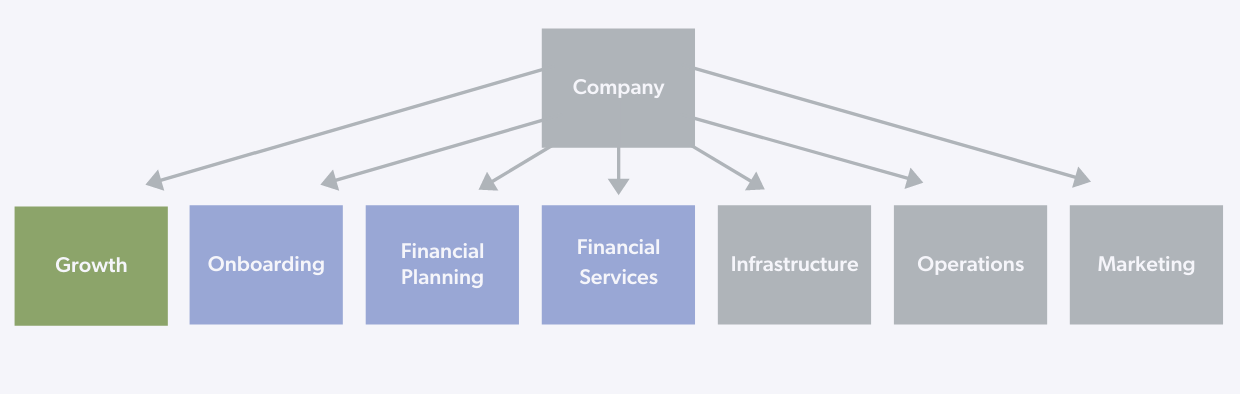
Another version of striking a balance between optimization and innovation is as follows: In this case there are 3 innovation-focused product teams (in blue) and 1 product team (the growth team in green) that is focused exclusively on optimizing the existing features and experiences in order to improve the business metrics. This would lend itself to a split of 75% innovation and 25% optimization.
As noted earlier, companies need to pick their balance of “stocks and bonds”— i.e. their mix of optimization and innovation. However, they shouldn’t pick their mix once and set it for perpetuity. The mix should change over time depending on the circumstances of the business.
For example, if your company launched a new product line a few months ago and is experiencing exponential organic adoption, then the product clearly has product-market fit within your customer base. It may make sense for that product team to then spend 3-6 months optimizing the existing features within that product line to maximize for adoption via some low hanging fruit experiments. This is especially true for network effects businesses since optimizing the drivers of the network effects can produce massive results. That was the case at Facebook where we spent a lot of time optimizing for sign up rate, new user onboarding, and getting people to add friends. By doing so we meaningfully accelerated the growth of the company due to it being a network effects business.
Conversely — and is the more common scenario I’ve seen at early stage startups — is that topline growth has stagnated as a result of having not shipped anything new and innovative in the last 1-2 years. That’s often the case since most businesses do not have a network effect and must therefore grow through new product innovation. The following example comes from my time at Wealthfront. At one point three out of four product teams were setup to focus mostly on new product innovation (Onboarding, Financial Planning, Financial Services) and one team was set up exclusively for optimization (Growth). Within the Onboarding, Financial Planning, and Financial Services roadmaps, the teams then have an explicit balance of how much of their efforts is dedicated to building new innovative features versus optimizing the existing products.
In subsequent quarters, the mix would change based on new insights or overall changes to the business. The key point is to remain flexible and use this simple mental model of “stocks and bonds” to regularly communicate and decide the appropriate mix of optimization and innovation across the company and within each product team’s roadmap.
If you want to take a stab at designing your own org chart using a similar process, go ahead and copy this free template that I made available and create a version of your own. It provides guidelines for laying out your org chart, listing what you must accomplish for your customers in order to realize your mission and vision. It’s also a place for you to balance optimization and innovation within each roadmap, as well as list the customer success metrics for each innovation team.